Saturday, June 8, 2019

Vibration Time wave form : Single Frequency With Harmonics .


A harmonic is some exact multiple of a discrete frequency. The discrete frequency,called the fundamental, is the first harmonic. The second frequency, which is two times the fundamental frequency, is the second harmonic. The second, third, fourth, etc., harmonics can be either in phase or out of phase with the fundamental.

The phase relationships between the fundamental and the harmonics are valuable in diagnosing problems in rotating machines. Failure to understand and use the time signal and harmonic phase can result in diagnostic errors .

A single frequency without harmonics will have one positive-going peak per time period. The number of positive-going peaks in one time period of the fundamental frequency identifies the highest number of true harmonics. This is true for a single frequency with harmonics only, and is true regardless of the phase relationships between the fundamental and the harmonics. The amplitudes of the fundamental and the harmonics determine the amplitudes of the positive-going peaks. However, the phase relationships of the harmonics to the fundamental determine the locations of the positive going peaks in the signal.
Single Frequency with an In-Phase Harmonic.
Single Freq. with a 180 Degree Phase Shift and Harmonic.

Single Freq. with a 180 Degree out-of-Phase Harmonic.
However, both positive-going peaks are at the top of the signal. This can only occur if the second harmonic is 180 degrees out of phase with the fundamental.

These phase and amplitude relationships hold true for linear systems. However, most real applications contain nonlinearities,called distortion. The distortion can appear in the signal as a phase shift in one or more of the harmonics. Distortion of the signal can also generate additional harmonics in the frequency domain which are not true harmonics of the signal. Therefore, the number of peaks in the time signal must be checked for true harmonic content.

Continuing with phase relationships, the next step is to observe a phase shift of 90 degrees.
Single Freq. with 90 Degree Phase-Shifted Harmonic.
A good rule to remember is that if the source of the harmonic is tied to the source of the fundamental, such as a fixed, geared, or bolted coupling, the harmonic should be in phase. If the source of the harmonic is not tied to the source of the fundamental, the harmonic should be out of phase.
Single Frequency with a Lower Amplitude Harmonic.
After seeing the effect of changing amplitude , one can identify the effect of changing the amplitudes in other ways. Changing amplitude only affects the amplitude of the composite peak. It does not affect the number of peaks or the phase relationship of the composite.
Single Frequency with Two Harmonics.
The addition of a third harmonic will now be examined, along with the effects of changing the phase and amplitude. Changing the amplitude changes the amplitude of the individual peaks, as with two harmonics. Three positive peaks per cycle are present, indicating the three harmonics.

Single Frequency with Only Third Harmonic.

Single Frequency with Two Harmonics.

Single Frequency with Two Phase-Shifted Harmonics.
The time domain signal is necessary to verify which harmonics are true and which harmonics are caused by distortion.


Friday, May 3, 2019

Vibration Time wave form : Single Frequency

SINGLE FREQUENCY
A single frequency is often referred to as a discrete frequency and is the simplest form of frequency data. The time signalof a single frequencyand the resulting frequency spectrum from the Signal Analysis Program. The time period for each cycle is 0.01667 seconds and the signal is sinusoidal.

Sinusoidal simply means the signal follows the sine function. Mathematically, the time signal is:

The reason for using the cosine instead of the sine is because the starting point at time zero of the fundamental is the highest point. The cosine is the same as the sine, except for a 90 degree phase shift. In the real world, the signal can start at any point between 0 and 360 degrees .


When the time signal is processed by the FFT, it is divided into the amplitudes and phases of the individual cosine and sine functions. When a spectrum is displayed, the plot is an amplitude plot of the frequencies. If a complex FFT is performed, both the amplitude and phase are available, but only the amplitude is displayed. In the introduction, the frequency spectrum was said to lose the phase. In actuality, it may not be lost. It is just not listed or is discarded. Unless the phase is retained and viewed, the time domain signal must be used to identify phase relationships.

To reconstruct the time signals from the frequency domain, a starting point must be selected. When time equals zero, the cosine starts at maximum amplitude and the sine starts at zero amplitude. It is more consistent to start at the maximum amplitude of all signals, so the signals add at a time equal to zero.
This is a cosine function with a 180 degree phase shift. In rotating machinery, data taken from opposite sides of a motor should be the same, except the phases of the fundamentals should be 180degrees apart. This obeys all laws of physics.
Single Frequency 90 degrees phase shift
Single Frequency 180 degrees phase shift

Amplitudes of signals in rotating machinery will add or subtract, depending on their phase relationships.
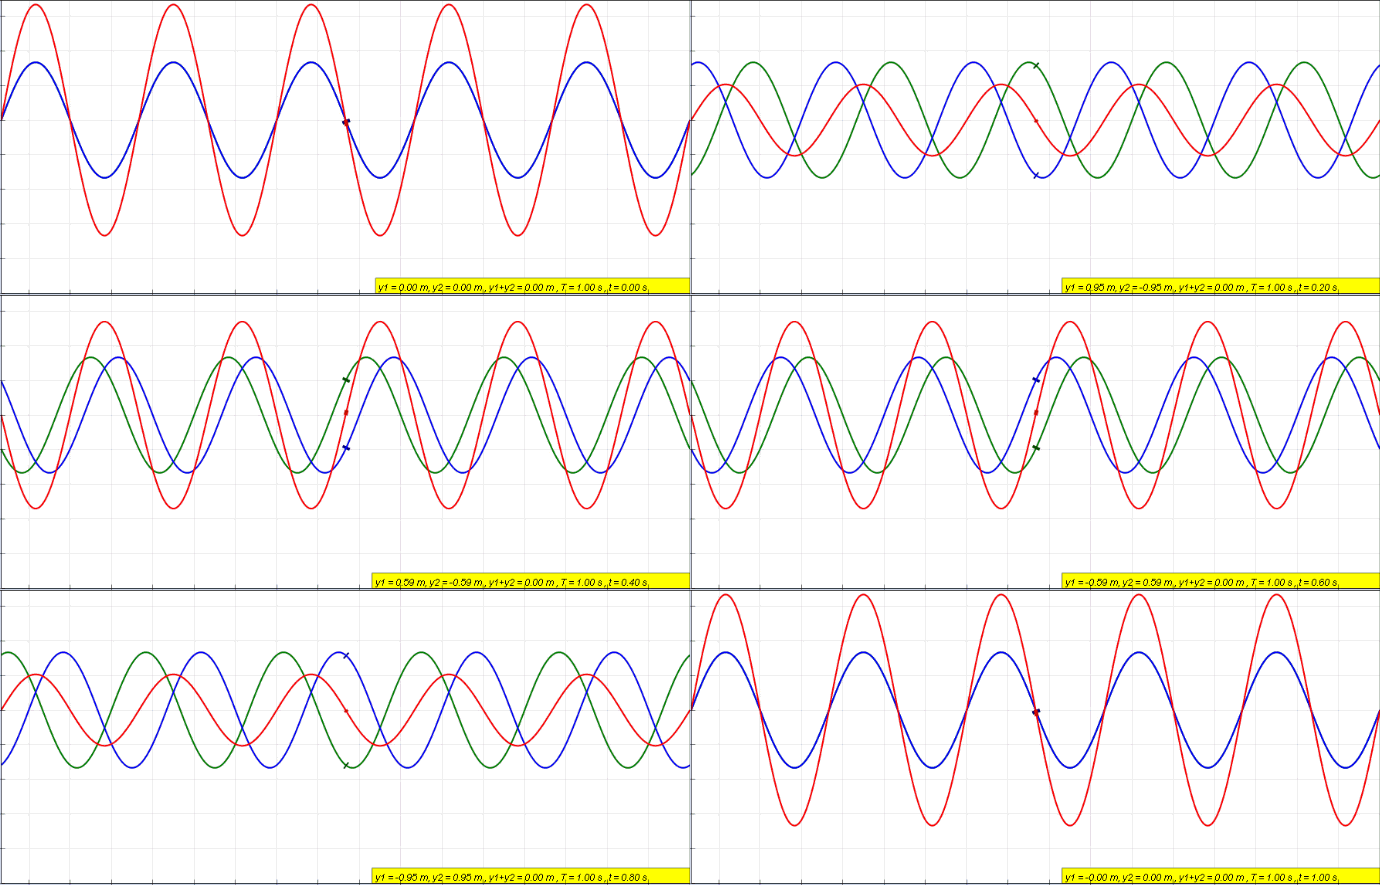
Two Frequencies signals 180 degrees out of phase to each other .
Two frequency signals equal in Amplitude & Phase

Thursday, May 2, 2019

Vibration : Time & Frequency Analysis

Accurate diagnosis of problems in rotating machines requires a thorough understanding of the time domain signal and the frequency domain spectra. Following are some of the reasons:

1. The time signal is a plot of amplitude versus time. This signal contains all frequencies, harmonics, and subharmonics. The phase relationships of these frequencies are also contained in the signal. Pulses, amplitude modulation, frequency modulation, truncation, and distortion are also present.

2. The frequency spectra are plots of amplitude versus frequency. These spectra contain frequency, harmonics, subharmonics, and sum and difference frequencies. The FFT produces the frequency spectrum from the time signal, based on electronic physics. However, during the process, some information is lost. For example, phase, true amplitude of pulses, nature of the pulses, bandwidth, and the various forms of modulation are not easily identified in the frequency spectrum.

3. A mechanical machine may not generate a fundamental plus harmonics in the same way as in the electronic world. However, a rotating machine does generate relatively linear signals when a linear problem exists, such as imbalance. A machine can generate a distorted signal as a result of a nonlinear problem. This distorted signal is a composite signal, as would be obtained after various frequencies and harmonics are combined.

4. For the above reasons, various time signals can produce the same frequency spectrum. This explains why the time signal must be considered. Costly errors in diagnostics and loss of credibility could occur if the time signal is not analyzed.

BASIC PHYSICS
 
All things in the universe obey the basic laws of physics. Vibration signals from rotating machinery must obey these same basic laws of physics. This is why we can take data from either side of a motor and receive the same results. (Some slight variations can occur in nonlinear systems because of transfer functions.) In a pure linear system, data taken in different directions around a motor should be the same, except for phase.
a sine wave is the plot of a circle against time. All complete circles contain 360 degrees and all complete sine waves contain 360 degrees. The phase of a signal can be anything from 0 to 360 degrees, depending on the reference point .
Before analyzing the time signal, an understanding of how frequencies add and subtract, and the effects of the phase relationships is required. It may be helpful to remember that multiplication is a series of additions, and division is a series of subtractions.

a signal taken from the horizontal direction with a signal taken from the vertical direction, one signal should lag the other signal by 90 degrees. This is because the positions from horizontal to vertical are 90 degrees apart on the machine. This phase relationship should also apply to other data taken at various points around the machine.

We can start taking data at any instant of time or location, and it does not make any difference. The reason for this is the phase relationship between the fundamental and other frequencies,or a once-per-revolution marker, will remain constant.

These frequencies will add and subtract, depending on the phase relationship. When the signals are in phase, the amplitudes will add. This is why positive side bands occur on some frequencies. When the signals are out of phase, they will subtract. This is why negative side bands occur. This also explains how and why truncation occurs.

In rotating machines, several different problems can generate the same frequency spectrum. For example, a machine that is loose can generate a fundamental and the second harmonic. A machine that has a bent shaft can also generate a fundamental and the second harmonic. The only way to determine which problem exists is to determine the phase relationship between the fundamental and the second harmonic. If these two signals are in phase, the shaft is bent. If the two signals are out of phase, the machine is loose. Currently, the only way to determine this phase relationship is with the time signal.

Saturday, April 27, 2019

Vibration signal processing (Overlap) :

Overlap
Consider the following example: If there is a need to collect and analyze a frequency range of 1 kHz, the data collection time (also known as the time window) for collecting 1024 samples could be exactly 40 ms. The FFT processor (Figure 4.7) can calculate and display a spectrum in 10 ms, after which it encounters an idle duration of 30 ms until the acquisition of the next block is completed.

Once the first block is collected, rather than waiting for the next block to be fully collected, it is possible to proceed and calculate a new spectrum by using part of the data from the new block and part of the data from the old block. If the process under consideration is stationary (not varying with time), the data from the two blocks can be averaged.


Considering the example mentioned above, we could initiate a new FFT calculation by using 75% of the previous block and 25% of the new one. We would then be performing a 75% overlap processing and our apparent processing time (after the first block) would be 10 ms per spectrum, rather than 40 ms. The method of overlapping becomes even more significant when we are operating at very low frequencies, or when we want to calculate many spectral averages.

For example, let us assume we are collecting data in a 100-Hz frequency range and wish to calculate 16 averages. The data collection time is 4 s, and without overlap processing we will need 64 s. With 75% overlap, we need 4 s for the first block and 1 s for each successive one, or 4 × 1 + 1 × 15 = 19 s to perform the same task. A considerable amount of time can be saved during data collection by the use of overlapping. Themethod enables more efficient use of the collected data. 

Vibration signal processing (Averaging):

Averaging
Averaging is another feature provided in analyzers/data collectors. The purpose is to obtain more repeatable results, and it also makes interpretation of complex and noisy signals significantly easier. There are various types of averaging:

• Linear averaging
• Peak hold
• Exponential
• Synchronous time averaging.

Linear averaging
Each FFT spectrum collected during a measurement is added to one another and then divided by the number of additions. This helps in obtaining repeatable data and tends to average out random noise. This is the most commonly used averaging technique. The spectra are typically averaged 2, 4, 8, 16 or 32 times, but any number could be used.

Peak hold
With this method, the peak value in each analysis cell is registered and then displayed. In other words, it develops an envelope of the highest spectral line amplitude measured for any average. This technique is used for viewing transients, such as coastdowns or random excitations that may be required during stress analysis studies.

Exponential
In this method, the most recent spectra taken are considered to be more important than older ones, and thus given more mathematical weight when adding and averaging them. This is used for observing conditions that change very slowly with respect to sampling time.

Synchronous time
This method uses a synchronising signal from the machine under investigation, and is used for averaging in the time domain. The synchronising signal is usually in the form of a pulse generated by a photocell or an electromagnetic pickup at a reference position on the shaft circumference. The vibration samples can in this way be taken at the same instant with respect to shaft rotation during averaging.

Non-synchronous vibrations in the system are effectively nullified by this method. The method is generally used if a machine has many rotational components rotating at different speeds. Thus, the vibrations synchronous with the synchronising signal are emphasized while others are averaged out.

Vibration signal processing (Lines of resolution,Fmax,bandwidth)

Lines of resolution, F-max, bandwidth

After calculation of the FFT on the digital signal, the frequency domain of the signal can be displayed on the collector/analyzer screen. The FFT is a spectrum of amplitude vs frequency. The resolution is the number of lines (or bins) that are used to display the frequency spectrum. The number of lines could be 200, 400, 800, 1600, 3200, 6400 and 12 800. F-max is the maximum frequency selected on the analyzer by the user when the data are collected. Bandwidth is calculated by dividing the F-max by resolution.

It can now be deduced that when resolution is high there is a better distinction between frequency peaks. Selection of F-max upon collecting data requires experience. If F-max is set too high, the bandwidth gets larger and resolution is affected. On the other hand, if the F-max is set too low, valuable high-frequency vibration data could be lost.

Furthermore, some may find it amusing to know that the time required for collecting the data varies inversely with F-max. The higher F-max, the quicker the FFT can be displayed. This is due to a fixed mathematical relationship between sampling rate and the number of bins in the FFT. As a general guideline, the following advice is provided to
No alt text provided for this image
select F-max values:
• For general rotating machinery likes pumps, fans, blowers and motors, set the F-max to 20× or 40×, where × is the running speed.
• When measuring vibrations on gearboxes, the F-max setting should be at least three times higher than the gear mesh frequency, where the gear mesh frequency is the number of teeth of pinion and gear times their respective running speeds.
• However, if an analysis on a machine is conducted for the first time, it is advisable to begin by taking two spectra, one at 10× the running speed and another at 100× running speed. This is to ensure that no important frequencies are lost in the high- or low-frequency zone. Once the range of the suspicious frequencies is noted, the F-max setting should be selected accordingly.

Friday, April 26, 2019

Vibration signal processing (Filters) :

Filters

Vibration signal from a transducer requires signal processing to produce the data that we need. The process usually involves filtering, setting sample rates and resolution, windowing, etc. It is important to understand what filters do and how they are used in the field of vibration. Filtering is a process that removes some frequencies from a signal in order to suppress interfering frequencies and reduce noise.

They are four types of commonly used filters:

1. Low pass filters
Low pass filters allow low frequencies to pass through. Low pass filters are the most common filter type because of the popularity in removing alias signals, and for other aspects of data acquisition and signal conversion.

2. High pass filters
High pass filters allow high frequencies to pass through. High pass filters are normally used in early bearing wear detection. A high pass filter is useful to block the high amplitude, lower frequencies to enable to “amplify” to the low amplitude levels of early bearing wear in the higher frequencies.

3. Band pass filters
Band pass filters allow frequencies within a band to pass through. Band pass filters transmit only those signal components within around a center frequency. Band pass filters are usually applied in situations that require extracting a specific tone, such as a test tone, from adjacent tones or broadband noise.

4. Band stop filters

Band stop filters block frequencies within a band from passing through. Band stop filters transmit all signals except those between specified ranges.

Ideally, filters would block unwanted frequencies and provide a clean cutoff and keep out of unwanted signals. However this is not the case. In reality, there is a transition region where some frequencies will be attenuated, but not blocked. The actual filter designs are shown in Figures. It can be concluded that it’s very important to understand filter types to enable us to look at the data that we are only interested in.

Vibration signal processing (Windowing) :

Windowing
After the signal was digitized using an A/D converter, the next step in the process (before it can be subjected to the FFT algorithm) is called windowing. A ‘window’ must be applied to the data to minimize signal ‘leakage’ effects. Windowing is the equivalent of multiplying the signal sample by a window function of the same length.

When an analog signal is captured, it is sampled with fixed time intervals. Sampling fixed time intervals can cause the actual waveform to get truncated at its start and end. The results obtained can vary with the location of the sample with respect to the waveform’s period.

This results in discontinuities in the continuous waveform. Windowing fills the discontinuities in the data by forcing the sampled data to zero at the beginning and at the end of the sampling period.

Windows can be thought of as a way to fill in the discontinuities in the data by forcing the sampled data to zero at the beginning and end of the sampling period (or time window), thereby making the sampled period appear to be continuous. When the signal is not windowed and is discontinuous, a ‘leakage error’ occurs when the FFT algorithm is applied.

The FFT algorithm sees the discontinuities as modulating (varying) frequencies and it shows as sidebands in the spectrum when none of these frequencies are actually present in the signal. The usage of windows also affects the ability to resolve closely spaced frequencies while attempting to maintain amplitude accuracy. However, it is possible to optimize one at the expense of the other.

There are many window functions. Some used in vibration signal processing are:
1. Rectangular & Uniform (basically no window)
2. Flat top
3. Hanning
4. Hamming
5. Kaiser Bessel
6. Blackman
7. Barlett.

Generally, only the first three window functions mentioned above are available in most
analyzers.

Rectangular (basically no window) When conducting a bump test for resonance or when trying to measure a single event or transient, use the “rectangular” window, which is the same as no window. This gives a good frequency reading but errs on the amplitude side of things. (Bump = Rectangular) .

Uniform
A Uniform window has a value of 1.0 across the entire measurement time . In reality, a Uniform window could be called “no window”.  Depending on the data acquisition system used, sometimes the term “Rectangular” window is also used.
Hanning or Hamming When collecting continuous vibration, say on a machine that is running at steady state; use the “Hanning” or “Hamming” window. These provide a good compromise between amplitude and frequency accuracy. (Continuous = Hanning, Hamming) .
When a Hanning window is applied to a non-periodic signal, the leakage is greatly reduced and the amplitude is higher.
Flattop The Flattop window has a better amplitude accuracy in frequency domain compared to the Hanning window . When calibrating a sensor, or when in need of very accurate amplitude readings, use the “flat top” window as this gives the most accurate amplitude reading but the worst frequency reading. (Accurate Amplitude = Flat Top) .


Wednesday, April 24, 2019

Vibration signal processing (Leakage) :

Leakage The FFT analyzer is a batch processing device; that is it samples the input signal for a specific time interval collecting the samples in a buffer, after which it performs the FFT calculation on that “batch” and displays the resulting spectrum .

When an analog signal is captured, it is sampled with fixed time intervals. Sampling fixed time intervals can cause the actual waveform to get truncated at its start and end. The results obtained can vary with the location of the sample with respect to the wave form’s period. This results in discontinuities in the continuous waveform.
The shape of the “leaky” spectrum depends on the amount of signal truncation, and is generally unpredictable for real signals. A ‘window’ must be applied to the data to minimize signal ‘leakage’ effects. Windowing is the equivalent of multiplying the signal sample by a window function of the same length .

Vibration signal processing (sampling & Aliasing) :

Sampling rate
Sampling is the process of recording the amplitude of a wave at given instants, and then generating a curve from the recorded points. Thus, the collected discrete sampled data points (digital) are used to reconstruct the wave, which was originally in an analog form. If the reconstructed digital wave has to look similar to the original wave, how fast should we record the amplitude, or in other words, take samples so that the digitized wave is an exact replica of the original analog wave?

The answer lies in the Nyquist sampling theorem, which states: ‘If we are not to lose any information contained in a sampled signal, we must sample at a frequency rate of at least twice the highest frequency component of interest.’
Aliasing
This phenomenon of formation of a lower-frequency wave due to undersampling is called aliasing. All data collectors/analyzers have automatically selected built-in sampling rates to ensure that no aliasing occurs. In theory, there should be no vibrations with frequencies of more than half of this sampling rate. However, this can never be ensured in practice.

Therefore all analyzers are fitted with anti-aliasing filters. These are low-pass electronic filters, which allow low frequencies to pass but block higher ones. The filters remove all vibrations in the analog signal that have frequencies greater than half the sampling rate. These filters are automatically tuned to the proper values as the sampling frequency is changed (this occurs when the frequency range of the analyzer is changed by the user). It is very important to note that filtering has to occur before digitization of the analog commences.

Vibration signal processing (Analog to Digital signal conversion ):

The vibration of a machine is a physical motion. Vibration transducers convert this motion into an electrical signal. The electrical signal is then passed on to data collectors or analyzers. The analyzers then process this signal to give the FFTs and other parameters. We will take a brief look at the processing of the signals, which finally provide us with the necessary information for condition monitoring. To achieve the final relevant output, the signal is processed with the following steps:

• Analog signal input
• Anti-alias filter
• A/D converter
• Overlap
• Windows
• FFT
• Averaging
• Display/storage.

Before we can discuss the above-mentioned digital signal processing steps, we need to take note of a few more terms and concepts.
A vibration or a system response can be represented by displacement, velocity and acceleration amplitudes in both time and frequency domains . Time domain consists of amplitude that varies with time. This is commonly referred to as filter-out or overall reading .

Analog to digital converters
The vibration waves collected by transducers are analog signals. Analog signals must be converted to digital values for further processing. This conversion from an analog signal to a digital signal is done by an Analog to Digital (A/D) converter. The A/D conversion is essentially done by microprocessors. Like any digital processor, A/D conversion works in the powers of two (called binary numbers). A 12-bit A/D converter provides 4096 intervals whereas a 16-bit A/D converter would provide 65 536 discrete intervals .

The greater the number of intervals, the better is the amplitude resolution of the signal. A 12-bit A/D converter would result in a resolution of 0.025% of the full scale, whereas a 16-bit A/D converter would yield a resolution of 0.0015%. It is thus possible to collect a signal with large and small amplitudes accurately.

It can be seen here that the sampling rate determines the highest frequency in the signal that can be encoded. The sampled waveform cannot know anything about what happens in the signal between the sampled times. Claude Shannon, the developer of the branch of mathematics called information theory, determined that to encode all the information in a signal being sampled, the sampling frequency must be at least double the highest frequency present in the signal. This fact is sometimes called the Nyquist criterion.

Flow Induced Vibration , Noise in Pipes

  Piping vibrations Vibration of process plant piping can be a significant risk to asset integrity and safety. This is often due to f...